Abstract
There is a need for software to monitor routers statistics as routers are being developed. There is also a need for network managers to monitor the networks for which they are responsible, some of which may be suitable for router developers. There are well over 100 software packages available, both commercial and open source, which monitor some aspect of router statistics, presenting data in both image and tabular format. Many monitor for specific data such as attacks, network performance, router congestion, etc. Some are free standing packages, others use the web and/or a web server to perform the monitoring and generation of statistics in graphical format. Some use ping round trip times while others use RMON. A list of those that measure some statistic in real time are listed at the end of this paper. Since the router in our project will not support SNMP, a more generalized method of monitoring with graphical output in real time is needed.
Introduction
In order to optimize and compare different approaches to router design, performance monitoring is needed to conclude which design is optimal for a particular application, and which compromises must be made to accommodate a variety of traffic types and remain within cost constraints of the design. Most available performance monitoring is oriented towards the network administrator. There is a need for monitoring methods oriented towards the router designer. In this project, I have written software in C++ and OpenGL that may be used for this purpose, but is also generalized so that it may be used for any other project needing real-time 2-axis data display.
Graphical Display
For most people, data is more easily and more quickly understood if it is graphically presented. Several approaches are available, one of which produce an image file, which is not suitable for real-time display, the other approach produces an image of the data directly on screen, which is the only approach suitable for real-time data display.
There are constraints and requirements that must be considered.
- Since the router will be producing statistical data very quickly, the only way a user will be able to understand the data is to view a graphical representation of it.
- The display must be fast enough to keep up with the data input from the router statistics being generated.
- There must be enough data points to show a meaningful graphical output.
- There must not be too many data points where the entire graph is covered with data points obscuring the pattern (it is possible that if data is collected long enough, every pixel on the screen could become illuminated).
Many statistics are available from routers and are desirable to be monitored to assess a particular router configuration, among which are:
- Response time
- Delay-Latency
- Throughput
- Bandwidth
- Queue size (length)
- Queue fill (or fill between high and low limits)
- Loss
- Packet length
- Packet rate
- Efficiency
- Utilization
- No of flows
It is useful to visualize some of these statistics vs. another statistic rather than visualizing one statistic vs. time. It is also useful to visualize the data in real time rather than storing data for later analysis. Plotting may points in real time will show the user how the data changes over time as more points generated in later in time are added.
OpenGL
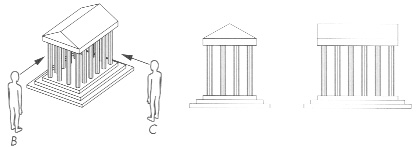
OpenGL was chosen because it is relatively easy to learn (with a moderate learning curve), can display data in real time, is available on all platforms (including mainframe), and integrates with many programming languages (including C++ which is used in this implementation). OpenGL was designed to display 3D objects. As shown in Fig 1, an object may be viewed obliquely (Fig 1a), or from the perspective of viewer B (Fig 1b) or viewer C (Fig 1c)
(a) (b) (c)
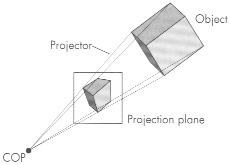
Fig 1As objects are rotated, translated, or scaled, the view seen by each viewer changes. In OpenGL, images are projected to a viewing plane which is the image that the viewer sees. Rotation, translation and scaling can be performed by moving the viewer rather than the object, and projecting the image in the direction of the user. Objects can also represent convergence of visual lines as they appear naturally (such as rail tracks appearing to become closer in the distance). Fig 2 shows how OpenGL projects objects onto a projection plane showing this effect.
Fig 2
The COP (Center of Projection) shows how projection lines meet to to show an object in perspectiveFig 3 shows how objects are projected onto an image plane. Since the viewer can see the object from any angle, to display data points and view them without an oblique distortion, they need to be projected perpendicularly to the plane of the plotted points to a projection plane parallel to the plotted points. One additional consideration is shown in Fig 4; the viewing window needs to be located so that the object is within view for the user, meaning that the points plotted must be scaled to fit in the viewing window.
Fig 4

Implementation Requirements and Considerations
Since the router may generate points very quickly, the visualization must be able to accept points as quickly as they are generated. Two methods were used to speed the visualization display: 1) arrays were used rather than lists to eliminate the time to allocate memory. 2) While scaling occurs with each new point received, calculations of the scaling factors is done periodically.
Fixed array sizes, length 1000 were used as a compromise, and not pre-allocating too much memory. Too few points and the data visualization may not be meaningful. Too many points could conceivably illuminate every pixel on the screen, again becoming meaningless. While the complexity of reading an array is O(n), if 1,000,000 points were stored and displayed, it would take 1000 times longer than 1000 points, possibly slowing the display to a speed less than the rate of supplying the data from the router.
Scaling is done with each point so they will be in the correct relation with each other. However, the scale factor is only calculated when the 10th, 100th and 500th point is received. The arrays are arranged as if they were a circularly linked list. The newest data point received replaces the oldest data point. As new points replace old ones, the scale factors are recalculated at the same points each cycle of the array (e.g.: at point 1010, 1100, 1500, 2010, 2100, 2500, etc). While the first 9 points may be displayed outside of the visibility window, it is expected that many more than 9 points will be displayed. The viewing window is from -0.1 to 1.5 in the X and Y coordinates so that points received after the scale factors are calculated that after scaling exceed 1 will still likely be displayed (between 1.0 and 1.5) until the point is received that causes the scale factor to be recalculated (bringing the visualization back within 0.0-1.0 range).
It was decided to implement the visualization so that it could be used to display any data source rather than a visualization specifically for displaying router statistics. To be more useful, the visualization was implemented with a listener and client so the data could be visualized remotely. Some experiments were done (before adding an ack to the transfer of data between the client and the listener). It was found that when running the client and listener-display on different hosts, data points were occasionally lost when a delay of 100ms was added (with Sleep(xxx)), but that when a delay of 200ms was added, no data points were lost. It is possible that the long delay was restricted to the times that the scale factors were being recalculated. When the client and listener-display were run on the same host, a delay of 1ms was always sufficient to avoid losing data points. The use should be aware of this when using the visualization remotely, it may not be significant if the points are not being generated very quickly (the user may choose to display means or variances accumulated over intervals exceeding 200ms). Since the difference in delays were so large, the added Sleep() delay was removed and an ack was added from the listener-display to the client to tell the client that the listener-display was ready to receive more data, thus avoiding a fixed dealy.
Code (C/C++) code for each algorithm
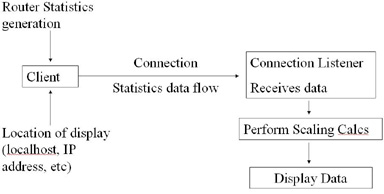
The code for this project uses OpenGL to display scatter plots of incoming data. In one part (vis.cpp), as a convenience for users, a listener was incorporated to received data remotely. The data display may be used either locally or remotely. The listener runs in a different thread so that it can receive data simultaneously with displaying data. There is a corresponding part of the code is the user interface (visClient.cpp), which must be incorporated into the code which generates statistics. As written here, for testing purposes, the visClient has been written to read files locally which contain window titles and data to be sent to the listening display (vis.cpp). A block diagram of the flow of data is show in Fig 5.
Fig 5
The Listening-Display (vis.cpp)
This program listens for input in a listening thread for users sending program to send either setup data or data to be plotted on one of 9 scatter plots. The main thread plots points as a scatter plot as they are received on each screen. The data in the array is normalized to between 0 and 1 for consistent display. Normalization takes place after 10, 100 and 500 tuples are received for a particular display window to keep the points visible within that display window, and to refine the normalization twice after a significant number of tuples are received. New tuples received after the array for each window is full replaces old data to always display the newest MAXDATA points. Note1: global variables are used instead of message passing because they are faster. Note2: if this program is run on the same host as the client, data transfer takes on the order of (up to) 1ms, while if they are on different hosts, data transfer takes on the order of (up to) 200ms (as tested on a 100MHz LAN between a client running on a 400MHz PII and the display running on a 200MHz PII, a worse case test, and using sleep() which has a resolution down to only 1ms, so the localhost test may have been much less than 1ms). While faster processors would obviously have less delay, there is a tradeoff between being able to send data quickly and being able to monitor remotely.
The listener runs in a child thread. A socket is created for the current host IP address and PORT 32767, an unassigned IANA port number, begins listening for a socket connection request from a client, and after accepting a connection from a client, stops listening for new connections. Data is received from the client in a while(TRUE) loop. The listener expects data to be received in this order: data type, intended screen destination, x value, y value; all data is separated by spaces. Data types are either setup (0) or data (1). Screens are 1 through 9. X values and Y values for setup are the names such as Throughput, Delay, Bandwidth, Queue_Length, Loss, Latency, Packet_Rate, Efficiency, Utilization, etc. X values and Y values for Data type: data are floating point values (double). Each of the four elements of each tuple are acknowledged separately. It was found to be necessary to do this because it was not known if the data would be coming from a localhost or from a remote host, and the time differences are so large that if a short time was used (in anticipation of a localhost source), some data would be lost, and if the delay was set to a longer time, data from a localhost would be unnecessarily delayed. The ack is just an x sent to the client, although what is sent is not important, the client just test to see that something was received from the listener. For data type: setup, the values received are inserted into the appropriate variables for each window via a switch structure. The values are then used to title each window, so the user will know what the values represent. For data type: data, the values are separated by screen by a switch structure. In each screen, the incoming values are immediately scaled to fit in the display window and stored in an array of structs containing the scaled x and y values. Two counters are used, one containing the total number of tuples received for that screen (which tells the display how many points to display) and the other containing the current array position pointer, which is used if the arrary becomes full and wraps around. In the case of the array not being full, both counters will have the same value. In the case of wrap around, the first counter will just be the size of the array (so that the display will display all points in the array) and the other will be a pointer to the tuple which is to be replaced (the oldest data) when a new tuple is received. Values to which the incoming data is to be normalized are recalculated at the 10th tuple, 100th tuple and 500th tuple (out of an array size of 1000). This was a compromise between having the data re-scaled often enough to stay in the visible window and not wasting processor time re-scaling after each tuple. Since the visible world of the display window is 50% larger than the current scaling value, incoming values which exceed the scale value should still be displayed until the re-scaling point is reached. Current values used for scaling, which are the maximum values at the tic marks on the axes, can be seen at any time by pressing the "m" key for the screen which has focus.
The displays run in the parent thread. The user first encounters a reminder messagebox saying to exit the program by using the escape key so that threads and thread handles, etc can be properly cleaned up. Next, the user encounters another message box, which is the help screen. It shows which keys perform which function (displaying screens, displaying the help screen, displaying max values used for scaling and exiting the program). Next, the user will see a screen entitled "This Window Intentionally Blank" containing a large X. The purpose of this window is to keep a window open, which is required with OpenGL, until some data is received. Since the listener must be started before the client, so that there is a listener to which it can connect, the display must have one window open to remain alive. After some data is received, one of the windows that display data may then be called (they could be called initially but they would not show any data and would not have a title; incoming data would be displayed as it was received in real-time but the screen would have to be called again by the user (by pressing key number for that screen) to display the title. Each screen (called by the number keys 1 through 9) draws a 600 x 600 pixel screen, containing an x and y axis and a mark on both the x and y axis showing the location of the maximum x and y values at the time of last re-scaling. glutIdleFunc is used to continuously refresh the screen when the parent thread is not performing some other task so that new tuples will be displayed in real time as they are received. Double buffering is used so that the new screen values are painted to the buffer in the background, and when it is finished, only then are the buffers swapped so that there is no jitter in the displays (as there would be if single buffering had been used where the calculations would be ongoing while the screen was being displayed). Points are plotted using a 2 x 2 pixel point as a 1 pixel point is very small and not easily visible.
The program was compiled with MS C++ 6 as a Win32 application but with the console turned off (since it is not needed). The code for the listener-display can be seen here.
The Client (visClient.cpp)
This program is the driver for vis.cpp. It should be incorporated in the program that generates the statistics for the router. It connects to vis.cpp on port 32767, an unassigned IANA port that the listening display listens on (that I happened to like because it is all 1s binary), and asks for an input of hostName which can be either a resolvable name like "localhost" or "b1" or it can be the IP address of the host running the listener and statistics display (this can be changed to hard-coded if desired). The code currently contains a driver which just reads in a file for testing purposes (to alieviate a lot of typing to manually sent points to the listener). This section should be removed when incorporating in the statistics generator. Data is in the following format: "dataType screenNo xData yData". All data is separated by spaces. dataType can be 0 (setup, send the name of the x axis and y axis) or 1 ( data, values of x and y data ). For example: "0 1 Throughput Delay" tells the listening display server that this is setup data for screen 1, the x axis lable is Throughput and the y axis label is Delay. Next example: "1 1 0.56 1.42" tells the listening display server that this is data for screen 1, the x axis value is 0.56 and the y axis value is 1.42. Build strings to this format before sending them to the listening display server (vis.cpp).
The client first is asked for the name or IP address of the host which is already running the display listener (vis.cpp). It connects to that host on port 32767. If the connection is successful, it enters a while(true) loop to remain in the send data mode. It then enters another while loop which opens a file and reads the tuples from beginning to the end of file, sending the tuples one at a time and waiting for an ack from vis.cpp before sending the next tuple. After the data from the file has been sent, it returns to the outer while(true) loop and waits for another file name to be read and sent. The code to connect and disconnect from the display listener should be used as-is. The outer while(true) loop is what should be modified to send data being generated by the statistics generator. It is suggested that the first thing to be sent is all of the titles of the windows (the X and Y axis labels). Then send the data as it is generated. In this way, when a client views the window to view the data, it will have a title telling what they are viewing.
The program was compiled with MS C++ 6 as a Win32 application with the console turned on. It can be turned off if desired, however all sections of code must agree to use some other means of input and output to do this. The code for the visClient can be seen here.
Working Code
Working code can be downloaded here. Unzip it, start vis.exe (on the same or different host from the client, include the glut32.dll file in the same directory as vis.exe). Start visClient.exe (on the same or different host, the glut files are not needed for the client), type in the name or IP address (such as localhost, b1, etc, or 127.0.0.1, 131.123.190.109, etc), then type in the name of the file to be read and sent to the display. In the zip file, downloaded above, are 9 files, labeled 1, 2, ...., 9 which each contain one setup line with the name of the X and Y axes and some data tuples (none of the labels or data represents any real data, they are just arbitrary labels and numbers to demonstrate the function of the program.
Conclusions
No publications exist which address visualization of router statistics. There does exist well over 100 commercial and open source programs which will display statistical data for networks, some of which will display router statistics, however, all display data vs time. For router development, it is desirable to display one router statistic vs. another.
Router statistics are more quickly understood if they are graphically displayed. Graphical displays used for displaying router statistics must be as fast as the router which generates the data. Precautions must be taken to make the visualization as fast as the router generates data (for real-time data displays) or data points will be lost.
OpenGL is a useful took for displaying real-time graphical displays.
A PowerPoint presentation is available here in 1 slide per page PDF format, or here in 4 slides per page PDF format
If you wish to view the speakers notes, use the PowerPoint presentation here, or the OpenOffice Presentation here..
References
Research papers for more information on this topic:
- Scriptroute- A Public Internet Measurement Facility, Neil Spring, David Wetherall, and Tom Anderson.pdf, USENIX Symposium on Internet Technologies and Systems (USITS), 2003
Tools for Analyzing Router Statistics, Tony Kom, University of Idaho, National Radio Astronomy Observatory, REU Research Summary
Network performance visualization- insight through animation, Brown J.A., McGregor A.J., Braun H-W, Proceedings of PAM2000: The First Passive and Active Measurement Workshop (Univ of Waikato Network Research Group, NZ)
Macroscopic analysis of the infrastructure- measruement and visualization of the Internet connectivity and performance, Bradley Juffaker, Marina Fomenkov, David Moore, kc claffy, (Univ Calif, San Diego), presented at PAM2001 , Amsterdam.
- Edward Angel, Interactive Computer Graphics: A Top-Down Approach with OpenGL, Second Edition, Addison-Wesley 2000 ISBN: 0-201-38597-X
- Report from the ISMA Network Visualization Workshop, ISMA 1999 (Internet Statistics and Metrics Analysis)
Web references:
http://www.caida.org/tools/taxonomy/ CAIDA collects information on availability of Internet and TCP/IP measurement tools as well as network visualization resources.
http://www.slac.stanford.edu/~cottrell/tcom/nmtf-tools.html Network Monitoring Tools from Stanford Linear Acceleration Center - This is a list of tools used for Network (both LAN and WAN) Monitoring tools and where to find out more about them.
http://www.opengl.org/ This is the organization responsible for setting and maintaining standards for OpenGL for all platforms, all windowing systems (desktop computers, cell phones, game consoles, avionics, supercomputers), and bindings to all languages (C, Java, Fortran, Pearl, Pike, Python, Ada, etc)
http://www.nas.nasa.gov/Groups/VisTech/visWeblets.html This page is an annotated bibliography of scientific visualization web sites around the world, including Universities, Governmental organizations, Commercial and Military visualization research facilities. It is a service of the NAS (Numerical Aerospace Simulation) Facility at NASA Ames Research Center. Please note that this page is no longer maintained due to other obligations of NAS personnel. Many of the links and descriptions may be incorrect or out-of-date. However, it is extensive and well worth viewing for relevant research groups. Since it is no longer maintained and may be deleted, I have included a local copy here.
http://www.msci.memphis.edu/~maleticj/visual/ Workshop at the Univ. of Memphis on Data Visualization (one of the organizers was Dr Maletic from Kent State)
http://www.cc.gatech.edu/gvu/datavis/ Data visualization group at Ga Tech. They study real time data analysis and display, for areas such as weather visualization, GIS, simulations, etc.
http://www.ccom.unh.edu/vislab/projects.html Univ. of New Hampshire's and NOAA's lab for Coastal & Ocean Mapping and Joint Hydrographic Center
http://www.cs.washington.edu/research/networking/scriptroute/ Univ. Of Washington, Scriptroute is a flexible network measurement and debugging system. Measurements are expressed as scripts that run as an ordinary user, and a priviledged daemon schedules and manages the packet exchange. The goal is to allow any user to connect to any server and execute any safe network measurement.
http://pam2000.cs.waikato.ac.nz/ PAM2000, the first Passive and Active Measurement Workshop
http://www.ripe.net/pam2001/ PAM 2001, the second Passive and Active Measurement Workshop
Existing tools which measure some router statistics in real time:
Commercial:
Analizers/Sniffers:
-
LANWarch Windows software-based network packet analyzer monitors traffic in real time and displays a wide range of statistics in graphical form.
-
Ultra Network Sniffer for Windows lists network packets in real-time from multiple network cards and also supports packet capture.
Applications/Services monitoring:
-
Argent Argent has three products - The Argent Guardian, a real-time monitoring and alerting system for NT/2000 servers as well as SNMP-compliant devices; The Argent Predictor, a trend-analysis product for both NT/2000 servers and SNMP devices; and The Argent Sentinel, a web monitoring product.
-
egInnovations provide Enterprise Management Products with capabilities involving the ability to offer subscription based remote monitoring through a web browser console, real time monitoring and problem diagnosis and proactive alerts.
Flow Monitoring
-
InMon provides traffic flow monitoring tools for high-speed switches. The software is able to monitor tens of thousands of switch ports continuously, producing real-time top flows charts, and site-wide application-level traffic matrices.
-
NetDetecor from Nicksun a non-intrusive network security monitoring product that (when deployed as part of your data communications infrastructure) inspects traffic flows, detects the activities of intruders, sets alarms, makes continuous copies of data from the network, and analyzes every packet in the network in real-time at production network traffic rates.
-
NetIntercept is delivered as a complete system, with hardware and software pre-installed, and captures in real-time and provides later on demand batch analysis of the data.
Other tools
-
NetReality provides monitoring and QoS shaping on all OSI layers, from 1 - 7 on WAN links. Real-time and historical reports are provided.
-
Silverback's InfoCare delivers real-time and historical information on faults, assets, performance and security across networks, systems and applications through a unified Web-based interface.
-
Telchemy provides Voice over IP (VoIP) passive call quality monitoring and active Quality of Service (QoS) management. Designed specifically to be embedded into VoIP end-systems, management devices and DSPs, Telchemy's non-intrusive monitoring technology, VQmonTM, is the only technology to model time-varying impairments and their effects on end-user-perceived quality in real-time.
-
VisualPulse from DataMetrics provide realtime and historical reports on RTT & loss.
-
Vivere Networks have a wireless sensor that monitor and analyze multi-AP topologies in real-time, including 802.11 packets for all access points in range as well as other IP network traffic.
SNMP Tools:
-
Open NerveCenter is a network management platform, based on SNMP, that is extensible using PERL. NerveCenter correlates events in real time from network and security devices, UNIX and NT systems and applications to improve availability, performance and security.
-
WinTDS monitors IP-SNMP devices and gives a variety of real-time views of the network status.
Public Domain:
Other Tools:
-
NetNow a prototype tool providing realtime NAP & ISP backbone delay & packet loss performance statistics.
-
NetStat Live is a small, easy to use TCP/IP protocol monitor which can be used to see your exact throughput on both incoming and outgoing data. NetTest Nettest is a secure, real-time network monitoring utility. The nettest framework is designed to incorporate existing and new network tests, and be run as a daemon or an interactive process. Requests for network tests are received via a SSL connection or the user interface and are authorized using an ACL list (in the future authorization using Akenti will also be supported).
-
RouteViews is a tool for Internet operators to obtain real-time information about the global routing system from the perspectives of several different backbones and locations around the Internet.
Packet Capture Tools:
-
Argus the network Audit Record Generation and Utilization System. The Argus Open Project is focused on developing network activity audit strategies that can do real work for the network architect, administrator and network user. It is a Unix based Real Time Flow Monitor designed to track and report on the status and performance of all network transactions seen in a data network traffic stream.
-
Ethereal is a free network protocol analyzer for Unix and Windows (including Win2K). It allows you to examine data from live network or from a capture file on disk. Also Packetyzer provides a new Windows User Interface that will available under the terms of the GNU Public License.
-
NetraMet and other realtime flow meters designed for Internet accounting including NetraMet (a traffic meter), NeMac (a combined manager & meter_reader) and NIFTY (a traffic flow analyzer).
-
Network Probe is a free Windows or Unix network monitor and protocol analyzer providing a picture of the traffic situation on your network and enables you to monitor network traffic in real time, hunt down, identify, and isolate traffic problems and congestions on your network.
-
The MGEN toolset provides programs for sourcing/sinking real-time multicast/unicast UDP/IP traffic flows.
-
RUDE stands for Real-time UDP Data Emitter and CRUDE for Collector for RUDE. RUDE is a small and flexible program that generates traffic to the network, which can be received and logged on the other side of the network with the CRUDE.
Traceroute:
- Prtraceroute is a version of traceroute, from the RIPE Internet Routing Registry toolset, that presents routing policy information together with the real time packet trace obtained from traceroute. It adds AS information to the normal traceroute output, making use of Routing Registry (RR) database information.