Colour Representation
[TEXT: 574-604]
Light
Visible light consists of a spectral distribution of electromagnetic energy
having wavelengths in the range 400-700 nm. The perceived colour of visible
light is to some extent a subjective experience.
The electromagetic spectrum
The following is a potential spectral energy distribution of light reflecting
from a green wall.
The Retina
The retina has both rods and cones, as shown below. It is
the cones which are responsible for colour perception.
There are three types of cones, referred to either as B, G, and R, or
equivalently as S, M, and L, respectively. Their peak sensitivities are
located at approximately 430nm, 560nm, and 610nm for the "average" observer.
Animals exist with both fewer and more types of cones. The photopigments
in rods and cones are stimulated by absorbed light, yielding a change in
the cell membrane potential. The different types of cells have different
spectral sensitivies:
Mapping from Reality to Perception
-
metamers: different spectra that are perceptually identical
-
colour perception: stimulation of 3 types of cones
-
surround effects, adaptation
Different spectra can be perceptually identical to the eye. Such spectra
are called metamers. Our perception of colour is related only to
the stimulation of three types of cones. If two different spectra stimulate
the three cone types in the same way, they will be perceptually indistinguishable.
Colour Matching
In order to define the perceptual 3D space in a "standard" way, a set of
experiments can (and have been) carried by having observers try and match
colour of a given wavelength, lambda, by mixing three other pure wavelengths,
such as R=700nm, G=546nm, and B=436nm in the following example. Note that
the phosphours of colour TVs and other CRTs do not emit pure red, green,
or blue light of a single wavelength, as is the case for this experiment.

The above scheme can tell us what mix of R,G,B is needed to reproduce
the perceptual equivalent of any wavelength. A problem exists, however,
because sometimes the red light needs to be added to the target before
a match can be achieved. This is shown on the graph by having its intensity,
R, take on a negative value.
In order to achieve a representation which uses only positive mixing
coefficients, he CIE ("Commission Internationale d'Eclairage") defined
three new hypothetical light sources, x, y, and z, which yield positive
matching curves:

If we are given a spectrum and wish to find the corresponding X, Y,
and Z quantities, we can do so by integrating the product of the spectral
power and each of the three matching curves over all wavelengths. The weights
X,Y,Z form the three-dimensional CIE XYZ space, as shown below.
Often it is convenient to work in a 2D colour space. This is commonly
done by projecting the 3D colour space onto the plane X+Y+Z=1, yielding
a CIE chromaticity diagram. The projection is defined as:
The chromaticity diagram looks as follows.
A few definitions:
-
spectroradiometer
-
A device to measure the spectral energy distribution. It can therefore
also provide the CIE xyz tristimulus values.
-
illuminant C
-
A standard for white light that approximates sunlight. It is defined by
a colour temperature of 6774 K.
-
complementary colours
-
Colours which can be mixed together to yield white light. For example,
colours on segment CD are complementary to the colours on segment CB.
-
dominant wavelength
-
The spectral colour which can be mixed with white light in order to reproduce
the desired colour. Colour B in the above figure is the dominant wavelength
for colour A.
-
non-spectral colours
-
Colours not having a dominant wavelength. For example, colour E in the
above figure.
-
perceptually uniform colour space
-
A colour space in which the distance between two colours is always proportional
to the perceived distance. The CIE XYZ colour space and the CIE chromaticity
diagram are not perceptually uniform, as the following figure illustrates.
The CIE LUV colour space is designed with perceptual uniformity in mind.
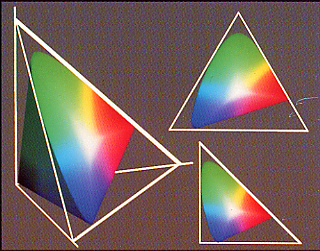
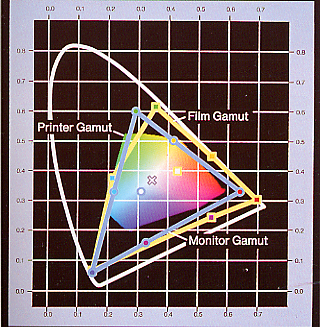
Colour Gamuts
The chromaticity diagram can be used to compare the "gamuts" of various
possible output devices (i.e., monitors and printers). Note that a colour
printer cannot reproduce all the colours visible on a colour monitor.
The RGB Colour Cube
The additive colour model used for computer graphics is represented by
the RGB colour cube, where R, G, and B represent the colours produced by
red, green and blue phosphours, respectively.
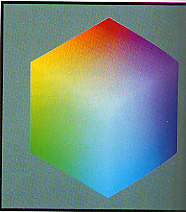
The colour cube sits within the CIE XYZ colour space as follows.
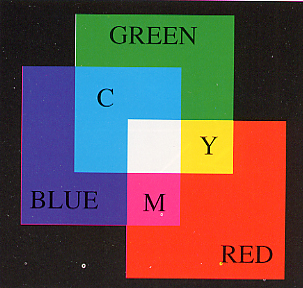
Colour Printing
Green paper is green because it reflects green and absorbs other wavelengths.
The following table summarizes the properties of the four primary types
of printing ink.
| dye colour |
absorbs |
reflects |
| cyan |
red |
blue and green |
| magenta |
green |
blue and red |
| yellow |
blue |
red and green |
| black |
all |
none |
To produce blue, one would mix cyan and magenta inks, as they both reflect
blue while each absorbing one of green and red. Unfortunately, inks also
interact in non-linear ways. This makes the process of converting a given
monitor colour to an equivalent printer colour a challenging problem.
Black ink is used to ensure that a high quality black can always be
printed, and is often referred to as to K. Printers thus use a CMYK colour
model.
Colour Conversion
Monitors are not all manufactured with identical phosphours. To convert
from one colour gamut to another is a relatively simple procedure (with
the exception of a few complicating factors!). Each phosphour colour can
be represented by a combination of the CIE XYZ primaries, yielding the
following transformation from RGB to CIE XYZ:
The transformation yields the colour on monitor
2 which is equivalent to a given colour on monitor 1. Quality conversion
to-and-from printer gamuts is difficult. A first approximation is shown
on the left. A fourth colour, K, can be used to replace equal amounts of
CMY, as shown on the right.
yields the colour on monitor
2 which is equivalent to a given colour on monitor 1. Quality conversion
to-and-from printer gamuts is difficult. A first approximation is shown
on the left. A fourth colour, K, can be used to replace equal amounts of
CMY, as shown on the right.
                   K = min(C,M,Y)
  C = 1 - R        C' = C - K
  M = 1 - G        M' = M - K
  Y = 1 - B        Y' = Y - K
Other Colour Systems
Several other colour models also exist. Models such as HSV (hue, saturation,
value) and HLS (hue, luminosity, saturation) are designed for intuitive
understanding. Using these colour models, the user of a paint program would
quickly be able to select a desired colour.