Introduction


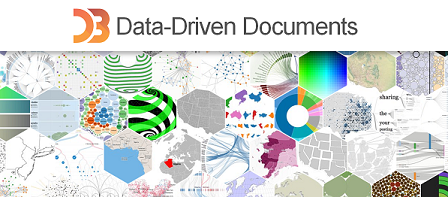
D3 (or D3.js) is a JavaScript library for visualizing data using web standards. D3 helps you bring data to life using SVG, Canvas and HTML. D3 combines powerful visualization and interaction techniques with a data-driven approach to DOM manipulation, giving you the full capabilities of modern browsers and the freedom to design the right visual interface for your data.

Source: D3.js


D3.js Concepts


This tutorial covers fundamental D3.js concepts from the ground up, and introduces basic visualizations.
- Technologies leveraged by D3: HTML, SVG, CSS, JavaScript
- SVG graphical elements: rect, circle, line, path
- Fundamental D3 concepts: CSV data, selections, scales, axes
- Visualizations: bar chart, scatter plot, line chart

Source: Introduction to D3, Tutorial & Examples By Curran Kelleher


Useful Resources